The Hidden Emissions of Electric Vehicles
Modeling the lifecycle emissions of passenger vehicles
• Data Modeling
• Information Visualization
• Web Development
Project Background: Capstone project at UC Berkeley (Dr. James R. Chen Award recipient)
Advisor: Dr. Marti Hearst
Team Members: Myself, Astoria Ho, Joshua Everts
Visit Project Website: https://eee-capstone.github.io/MIMS-Capstone/templates/index.html
For this project my team and I focused on investigation the environmental impact of passenger vehicles through looking at each vehicle's total emissions through its entire lifecycle. As policies continue to push for electrification and the adoption of electric vehicles, we found it important to evaluate how impactful these initiatives are to the environment and society. Our project aims to translate scientific findings from climate researchers into concepts that are easy to understand by the general public so that they can be better informed about electric vehicles and what sustainable transportation means.
During our project, we found that most of the necessary information for accurate lifetime emissions estimates is locked up in academic and government data, leading to a gap between consumer-facing information and the most accurate estimates. Thus, we were in contact with the EPA over the course of the project, as we hoped to make structured EV data more publicly available. To that end we have provided our data and code to the public in the hopes that others can learn from and add on to our results.
MY ROLE:
In addition to data collection and background research to create our model, my role in this project was focused on creating interactive information visualizations using design principles that can help users to better understand concepts that are introduced in our website. I was also responsible for the front end development of our emissions calculator and developing digestible outputs for the tool.
DELIVERABLES:
Using the data that we obtained both from direct conversations with the EPA and from previously public data, we were able to create an interactive website and a vehicle emissions tool, called Emissions Explorer.
We break down how and why EVs still emit, and let people explore how different factors-- charging location, vehicle type, and mileage–- all impact emissions.
The Emissions Explorer allows a user to input almost any vehicle (gas, hybrid, or electric) and outputs the lifetime emissions of that vehicle, along with useful context about how that vehicle compares to its peers.
We built our emissions model calculations using data from the GREET model, created by Argonne National Laboratory (ANL), and vehicle emissions and weight data from the EPA. Emissions Explorer models the production, use, and end-of-life emissions for a vehicle, and is the first tool to integrate these calculations into a digestible, consumer-facing product.
In addition to material inputs and outputs that our tool focuses on, we also look at societal factors that may affect EV adoption in our informational website.
DATA VISUALIZATION EXAMPLES:
A major part of this project was to communicate topics related to emissions, life cycle analysis, the electrical grid, and accessibility of electric vehicles.
Examples of data visualizations are provided below, and the remaining visualizations can be found on our project website.
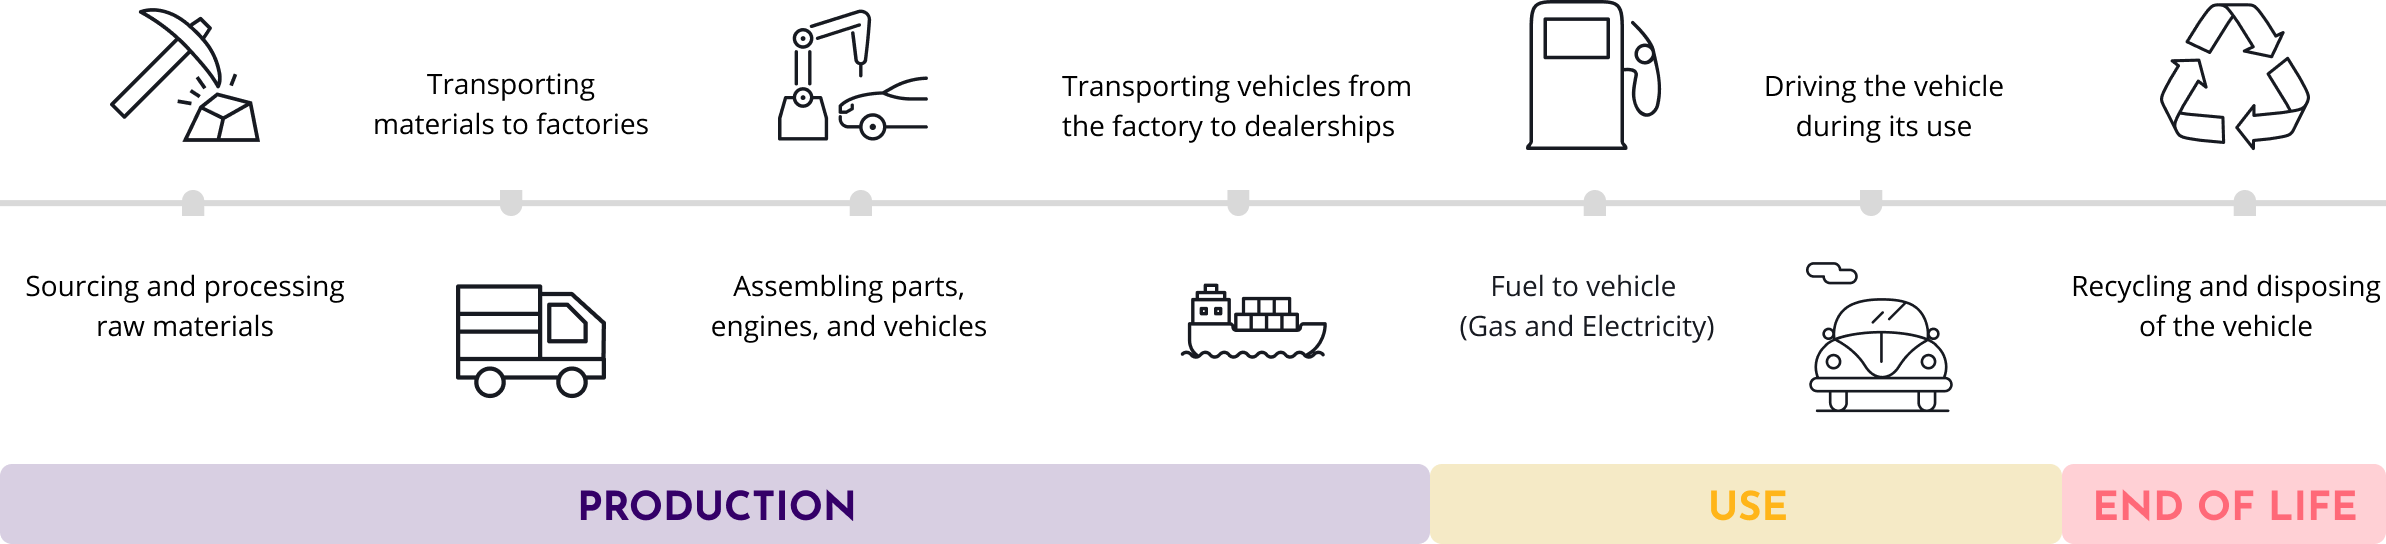
1. Vehicle Lifecycle Emissions
Emissions occur throughout a vehicle's life cycle, including during production, usage, and end-of-life phases. They span beyond just where the vehicle is used.
Direct emissions are produced when an individual drives a vehicle. These emissions include tailpipe emissions, electricity generation emissions, and fuel transportation emissions.
Indirect emissions are produced from other phases of the vehicle's lifecycle, such as production and end-of-life, may be invisible to the vehicle driver but is experienced strongly elsewhere in the world.
The following two diagrams were used to better illustrate lifetime emissions from vehicles.

2. Electric Grid Mix
The combination of sources used to generate electricity is called the Grid Mix.
The sustainability of grid mix varies from geographic region to region, and their reliance on fossil fuels (non-renewables) versus other cleaner sources (renewable, nuclear).
An electric vehicle charged from electricity generated from fossil fuels will have significantly more emissions than electric vehicles charged from electricity generated from renewable sources.
An interactive map and radar chart were created to allow users to explore grid mix in different regions in the US.
3. Charging Accessiblility
Often those who are in the most need of access to public chargers are located in poorer or more disadvantaged communities. Through brushing and linking, users can explore how demographics of certain California counties are related to charging accessibility.
EMISSIONS EXPLORER: Lifetime emissions are calculated by adding up emissions estimates from each stage of a vehicle’s life.
Inputs taken in the calculator include vehicle year, make, model, & configuration, ZIP code, and estimated ownership time.
This information is used, coupled with data from the GREET® model (Argonne National Laboratory), EPA vehicle data, and EPA grid emissions data, to calculate lifetime emissions.
GREET stands for Greenhouse gasses, Regulated Emissions, and Energy use in Technologies Model, and is the standard open-source vehicle LCA model.
How does the tool work?

Digestible Outputs: The Emissions Explorer's output focuses on two parts-- contextualization and unitization.
- Contextualization:
Allows users to make comparisons and better gauge what the given measure means. In this case, the emissions from the user-inputed vehicle are compared to the average emissions from vehicles of major vehicle types (electric vehicle, hybrid vehicle, internal combustion vehicle) from the same model year and same region.

- Unitization:
Re-expresses the measurement with a more familiar object as a unit. In this case, unitization is shown in two manners. First, for the lifetime emissions calculation, equivalencies to emissions from other common activities or scenarios, such as round trip flights are provided. These equivalencies keep a similar unit of travel.

Unitization is also used to scale down the concept of emissions over a lifetime to emissions per mile. An interactive output was created to calculate the emissions of a trip. The goal is for users to build a better mental model of vehicle lifetime emissions.

Emissions Explorer Demo:
Project Website Emissions Explorer Tool Final Report
UC Berkeley Web Page GitHub Repository